Welcome to REDIS Update - New data dashboard shows interesting differences in average hourly production between renewables in South Africa
The Renewable Energy Data and Information Service (REDIS) is now updated with new data up until June 2017. REDIS provides project data for 121 renewable energy generators, and now features more than one million hourly electricity production data records from 83 plants in operation, from April 2012 - June 2017.

In this REDIS Update, the hourly performance of wind power and photovoltaics (PV) for a statistically average day of production in South Africa across all years and provinces was analysed and compared .

The results show that average wind power output is relatively stable throughout the day, observing a peak around 17:00-19:00 (5pm - 7pm), which interestingly correlates with the demand peak.

Even though the average load factor for single-axis tracking PV is 19% higher than the load factor for fixed PV without tracking (REDIS Update #3), the analysis shows that fixed PV without tracking perhaps surprisingly perform 6% better than PV with single-axis tracking in the period between 11:00 and 14:00 (11am - 2pm). In the REDIS Insight Analysis below, a technical explanation for this phenomenon is provided, and seasonal differences are studied.

The findings have significant value in power system planning for integration of renewables, and may also be used as a basis for improved feasibility studies of investments in renewables.

Click here to interact with the new data dashboard now and study these findings in more detail.

REDIS Insight Analysis

For this insight analysis, a statistically average day of hourly production for renewables in South Africa across all years (April 2012 – July 2017) and provinces was compiled. Furthermore, seasonal variations in hourly production were analysed.

While the interactive dashboard available on REDIS holds data for all renewables (wind, PV, CSP, hydro, biomass, landfill gas), the analysis here focuses on wind power and PV with and without tracking.

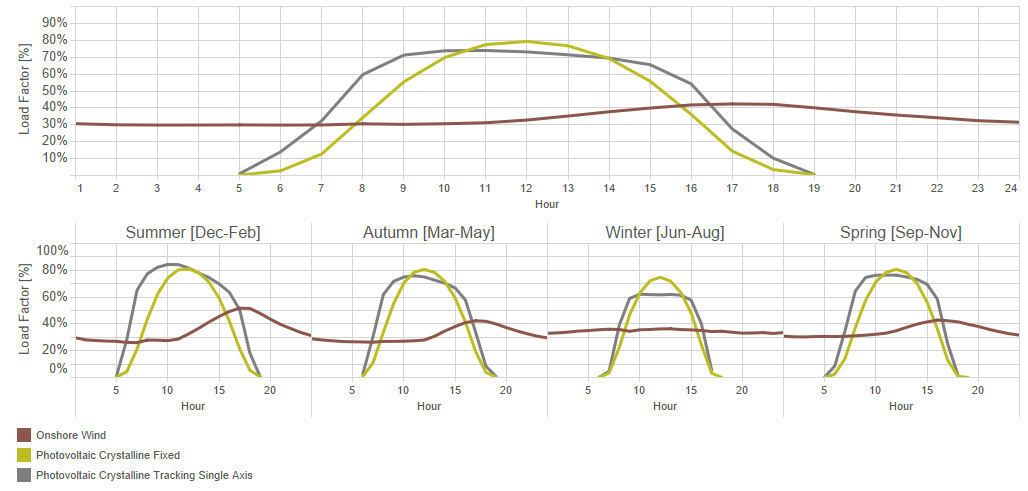
Average day of hourly production

The figure above illustrates that wind power output is relatively stable throughout an average day, observing a peak around 17:00-19:00 (5pm-7pm). The wind production peak correlates fairly well with the demand peak, which appears around 19:00 (7pm) in winter and 20:00 (8pm) in summer according to data from Eskom [Eskom, 2014].

In REDIS Update #3, it was shown that the average load factor for PV with single-axis tracking is 19% higher than the load factor for PV without tracking. However, when analysing the hourly variations, it is found that PV without tracking is performing 6% better than PV with single-axis tracking in the 3-hour period between 11:00 and 14:00 (11am - 2pm).

As illustrated above, PV with single-axis tracking produces more electricity than PV without tracking from 5:00 – 11:00 (5am – 11am) 
and again from 14:00 – 19:00 (2pm – 7pm). While this results in a higher overall load factor for PV with single-axis tracking, the load factor in the middle of the day is actually higher for PV without tracking.

In order to understand this phenomenon, it is necessary to understand that:

1. The performance of PV depends on the angle of incidence – the lower the angle, the higher the performance, and

2. That majority of PV installations with single-axis tracking in South Africa are so-called horizontal single-axis systems, which tracks the sun from east to west. An illustration of PV tracking systems is included in the notes below.

A horizontal single-axis system tracking from east to west is gradually tilting the panel to minimize the angle of incidence. However, at mid-day, the horizontal single-axis PV panel is horizontal to the ground. This results in a higher angle of incidence, and thus lower production, than that of a PV panel without tracking, which is fixed tilted north towards the sun.

A tilted single-axis tracking system would be able to match the fixed tilted PV without tracking at mid-day. However, tilted single-axis tracking systems are more expensive than horizontal single-axis tracking systems, mainly as they cast more shadow and therefore require more land-use.

Seasonal variations

Significant seasonal variations are observed. For example, while wind power output is virtually constant on an average winter day, the afternoon peak is double than that of the morning output on an average summer day.

Visit REDIS Now!
Notes

In the figure above, the statistical representation of hourly production has been normalized to the installed capacity in each hour, where the value 1,0 (one) represents maximum output at full capacity.

The term load factor here describes the actual production as a fraction of the theoretical production at full capacity. For example, if a 1 MW-peak PV installation in a given hour produces 0,75 MWh, the load factor in that hour is 0,75. Subsequently, load factors can be averaged for days, months, and years. Please refer to REDIS Update #3 for an analysis of annual load factors.

References and Further Readings

B. Sørensen, Renewable Energy: Its physics, engineering, use, environmental impacts, economy and planning aspects, 2004.

Eskom, State of the power system quarterly update, September 2014.

G. M. Masters, Renewable and Efficient Electric Power Systems, 2004.

We would like to extend our thanks and appreciation to Jarrad Wright and his colleagues from CSIR - Energy Centre for their assistance in this REDIS Insight.

We are always eager to improve REDIS, and we want to serve you the best we can. If you are looking for data that you cannot find, or if you have questions to the presented data, then please contact us, and we will do what we can to meet your needs.

Click here for contact information and feedback

Thank you!
The REDIS Team
Department of Energy
192 Visagie Street, Pretoria
Disclaimer
Unsubscribe    |    View this email in your browser