Welcome to REDIS Update - New data shows photovoltaics (PV) in South Africa initially performing significantly better than assumed

In this REDIS Update, we have compared actual load factors for photovoltaics (PV) by technology with PV load factor assumptions provided by the Electric Power Research Institute (EPRI) in the report "Power Generation Technology Data for Integrated Resource Plan of South Africa". The analysis - which is referred in the chart above, and presented in further detail below – shows that PV initially is performing significantly better than assumed. In summary, actual PV production is initially 17%-23% higher relative to EPRI’s assumptions.

This insight is possible because REDIS is now updated with capacity and production data for photovoltaics (PV) by technology, i.e. crystalline-silicon without tracking (fixed), crystalline-silicon with single-axis or dual-axis tracking technology, and thin film without tracking (fixed).

A total of 2322 MW-peak PV is currently contracted, the majority of which is using c
rystalline-silicon with single-axis tracking technology (56% or 1291 MW-peak). A  total of 1479 MW-peak PV is currently in operation, the majority of which is crystalline-silicon without tracking technology (45% or 671 MW-peak). It is furthermore observed that thin film technology is gaining traction with currently 294 MW-peak in operation, while only a single PV installation using dual-axis tracking technology is in operation with 36 MW-peak.

Click here to interact with the new data dashboard for operational monthly PV capacity development by technology.

For all REDIS dashboards, data is available for download in various formats, including as a comma-separated file. Click here for instructions on how to download data for own analysis.

Detailed production data by technology is also available, subject to REDIS’s confidentiality protocol, as a result of which data is omitted if made up of less than 3 producers (number criterion) and a single producer must not make up more than 80% of the published production value (dominance criterion). Currently, 1.8% of the total production across all renewable energy technologies has been omitted. For example, for PV this means that production data and load factor is not provided for crystalline double axis tracking technology, which currently rests on a single project.

Click here to interact with the data dashboard for hourly production and annual load factors by technology.
REDIS Insight Analysis
New data shows photovoltaics (PV) in South Africa initially performing significantly better than assumed

The term “load factor” (sometimes referred to as “capacity factor” though definitions may differ) is defined as an installation’s average load divided by its peak load. For intermittent renewables, like PV and wind, which cannot always be dispatched according to the installed capacity, the load factor shows how much electricity is produced for a given installed peak capacity. Load factor accuracy is important when assessing the feasibility of intermittent renewables.

The Electric Power Research Institute (EPRI) provides a consolidated set of technology parameters in the report "Power Generation Technology Data for Integrated Resource Plan of South Africa", including load factors. For PV, EPRI provides average load factors for Cape Town (Western Cape) and Johannesburg (Gauteng) by technology.

R
EDIS currently provides a complete set of PV load factors by technology for Northern Cape.

Click here to interact with the data dashboard for hourly production and annual load factors by technology.

Load factors cannot be compared directly across provinces due to the difference in solar irradiation. However, in August 2016, the South African Weather Service published a paper comparing average solar irradiation by province. For example, the paper finds that average solar irradiation is 5.8% percent higher in Northern Cape than in Gauteng. Under the reasonable assumption that this difference results in an equally higher production, REDIS load factors for PV by technology in Northern Cape can be compared with EPRI load factor assumptions for Gauteng geographically adjusted for Northern Cape.

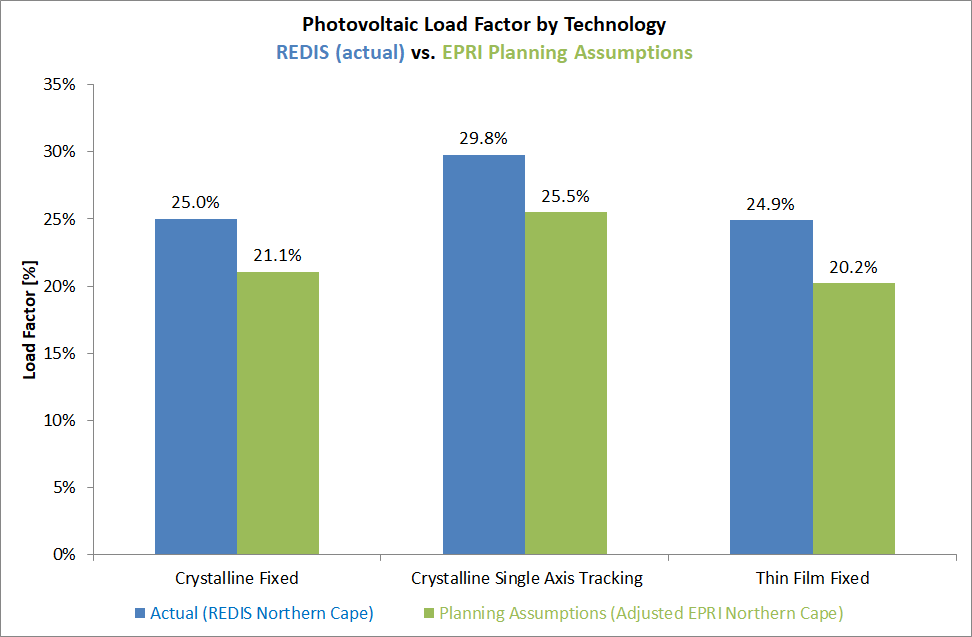
The result, illustrated in the chart above, shows that Northern Cape load factors for crystalline-silicon fixed and thin film are similar at around 25%, while the geographically adjusted EPRI load factors are about 21% and 20% respectively. The load factor for crystalline-silicon with single-axis tracking is almost 30%, while the geographically adjusted EPRI load factor is 25.5% In summary, the result shows that actual PV production is initially 17%-23% higher relative to EPRI’s geographically adjusted load factor assumptions.

It must be considered that PV load factors will be higher in the first years of operation due to degradation. For example, a 2012-paper from the National Renewable Energy Laboratories (NREL) under the US Department of Energy finds that PV module efficiency degradation is 0.8%-1.5% per year, lowest for crystalline-silicon, highest for thin film technology. A more recent 2016-paper from the European Commission Joint Research Centre, which is based on actual long-term field performance, finds that efficiency degradation of crystalline-silicon modules is only about 0.2% per year.

It must however also be considered that the degradation of existing installations may be compensated by an increase in PV module efficiency of future installations, resulting in average load factors being maintained at current or even higher levels.
Visit REDIS Now!
Notes

For crystalline-silicon technologies, REDIS load factors referred to in the analysis are based on the average of load factors in 2015 and 2016 for Northern Cape. For thin-film technology, the load factor is based on data recorded from April 2016 to March 2017. Load factors are compiled on the basis of hourly production and capacity data.


Crystalline-silicon is currently the dominant semiconducting material used in PV technology. Fixed tilt technology positions the modules at a fixed tilt or orientation. Single-axis or dual-axis tracker systems adjust the position of the PV array so that the PV modules track the sun. Compared to fixed tilt technology, REDIS data shows that single axis tracking technology will increase production by about 20% for the same size array. Literature indicates that dual-axis tracking can increase production by 5%-10% over single-axis tracking.

Thin-film technology is a second-generation PV technology made by depositing one or more thin layers of photovoltaic material on a substrate, such as glass, plastic or metal. This allows for thin film cells to be flexible, and lower in weight. Thin-film technology is typically only installed in fixed tilt locations.

References

Department of Energy, The Renewable Energy Data and Information Service (REDIS), June 2017.

Electric Power Research Institute (EPRI), Power Generation Technology Data for Integrated Resource Plan of South Africa, Technical Update August 2015.

South African Weather Service, Jyotsna Singh, Ranking South African provinces on the basis of MERRA 2D surface incident shortwave flux, Journal of Energy in South Africa, August 2016.

National Renewable Energy Laboratories (NREL), Photovoltaic Degradation Rates — An Analytical Review, June 2012.

European Commission Joint Research Centre, “Crystalline silicon PV module degradation after 20 years of field exposure studied by electrical tests, electroluminescence, and LBIC”, Progress in Photovoltaics: Research and Applications, Volume 24, Issue 3, Nov. 2015.
We are always eager to improve REDIS, and we want to serve you the best we can. If you are looking for data that you cannot find, or if you have questions to the presented data, then please contact us, and we will do what we can to meet your needs.

Click here for contact information and feedback

Thank you!
The REDIS Team
Department of Energy
192 Visagie Street, Pretoria
Disclaimer
Unsubscribe    |    View this email in your browser